Creating hierarchy out of ‘n’ categorical columns
Here is an R snippet that helps converting a data frame with multiple columns into a hierarchical format.
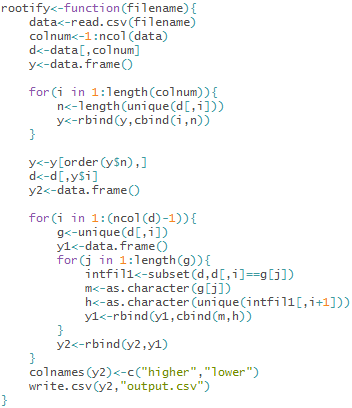
In the below image, the right hand side table is the output achieved with the rootify function which uses the left hand side table as input. All we provide to rootify is the name of the .csv file which has the data table to be converted into the required format.

The raw data as generated by rootify is valuable when it is further processed inside the arcdiagram/d3Network packages for easier and quicker data exploration. I will cover this in a future post.
Sanket
9
Kudos
9
Kudos