US Trade Deficits: A Change Point Analysis
While I was researching on ‘outlier detection’ techniques last week, I stumbled upon this well explained article on Change Point analysis.
Change Point analysis can be used to detect extreme/subtle changes in a time series and I decided to try writing the algorithm in R, starting with the case of Single Change Point Detection, before jumping onto the general case of multiple.
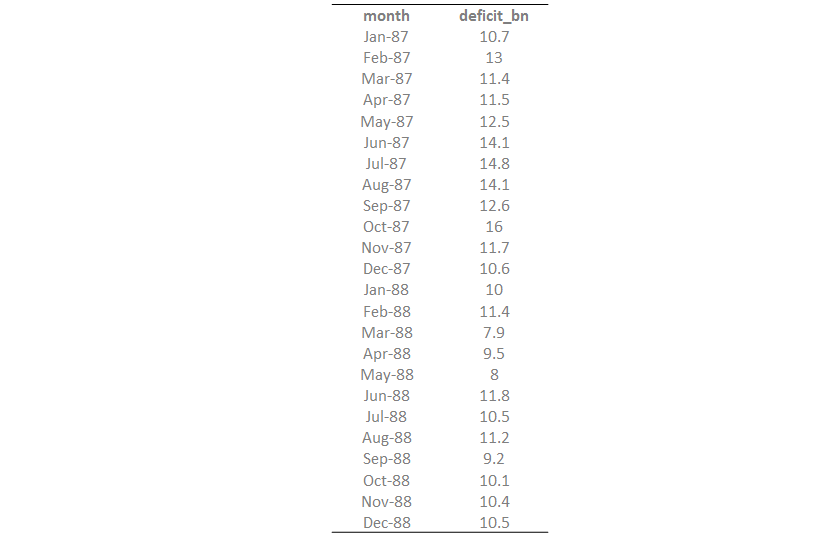
I borrowed the following data from here:
Following the article’s method, the function would primarily have three parts:
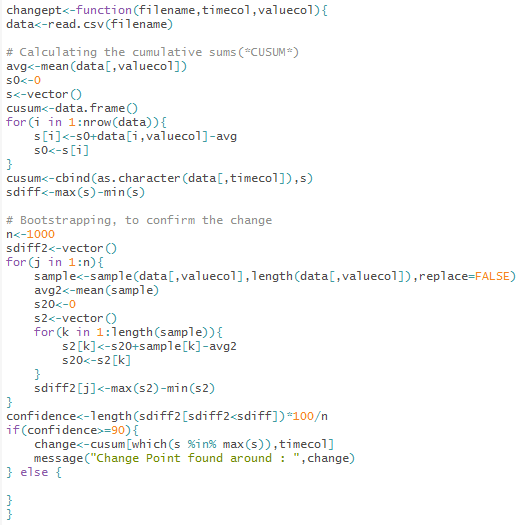
- Calculating the cumulative sums(CUSUM)
- Bootstrapping, to confirm a change
- Using the CUSUM Estimator to detect when the change occured
Here’s the R function:
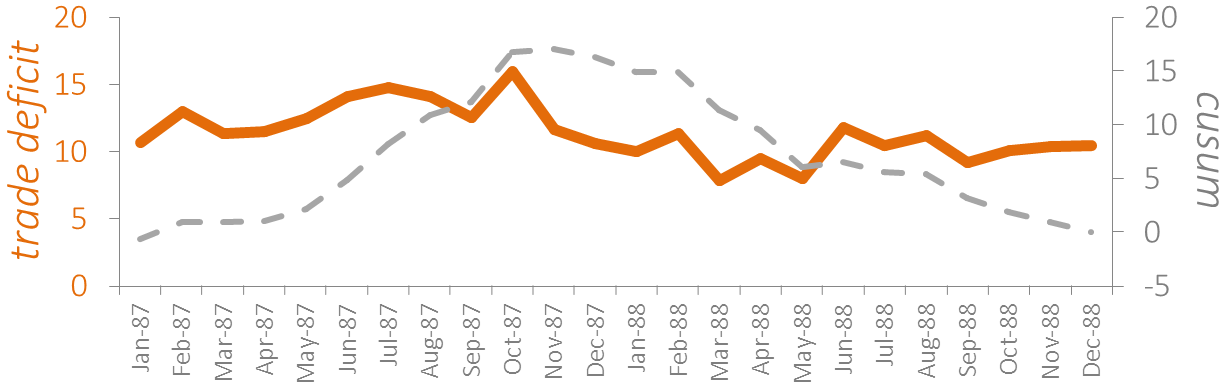
The below image shows output from the first part of the function i.e. calculating the cumulative sums, as a grey line overlayed on the orange line which depicts the original time series of trade deficits.
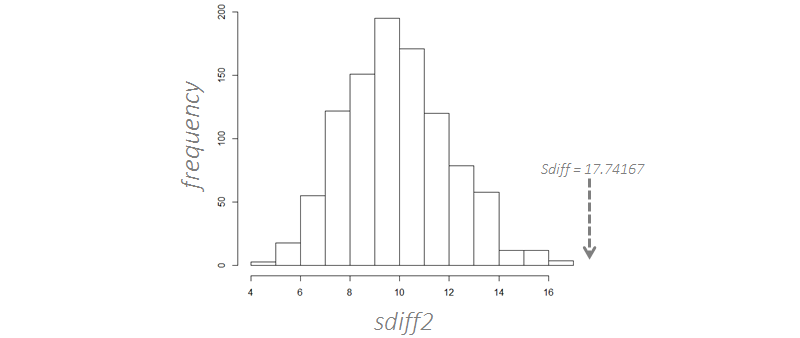
Moving right along, the output of the second part of the function is summarized in the following histogram, which shows that all of the 1000 samples have the Sdiff(Smax-Smin) value below that for the original time series, thus indicating there indeed is a change happening. Bingo!
Now, time to look at the output from the third part of the function, the CUSUM Estimator. Here is the output thrown at the console:

Yes. Change Point detected! And I just made some more progress with R! :)
Sanket